 Facebook
 Twitter
 Pinterest
 Copy Link
Last week I talked about the shortage of houses for sale in Pierce County being notably below the demand and how this condition makes the home buying and selling experience a little testy for many. Buyers have to make decisions quicker than they might otherwise like to, sellers face tricky waters getting their price right, and the negotiation process can have some tension that both may prefer to be without.
In the process of preparing that report I began to wonder; “Is demand really high or supply just super low?” I referenced some historical Pierce County housing data for perspective. The chart below represents 14 years of Pierce County housing activity. The bright green bars represent supply of homes; the dark green bars represent closings while the red line tracks Pending sales.
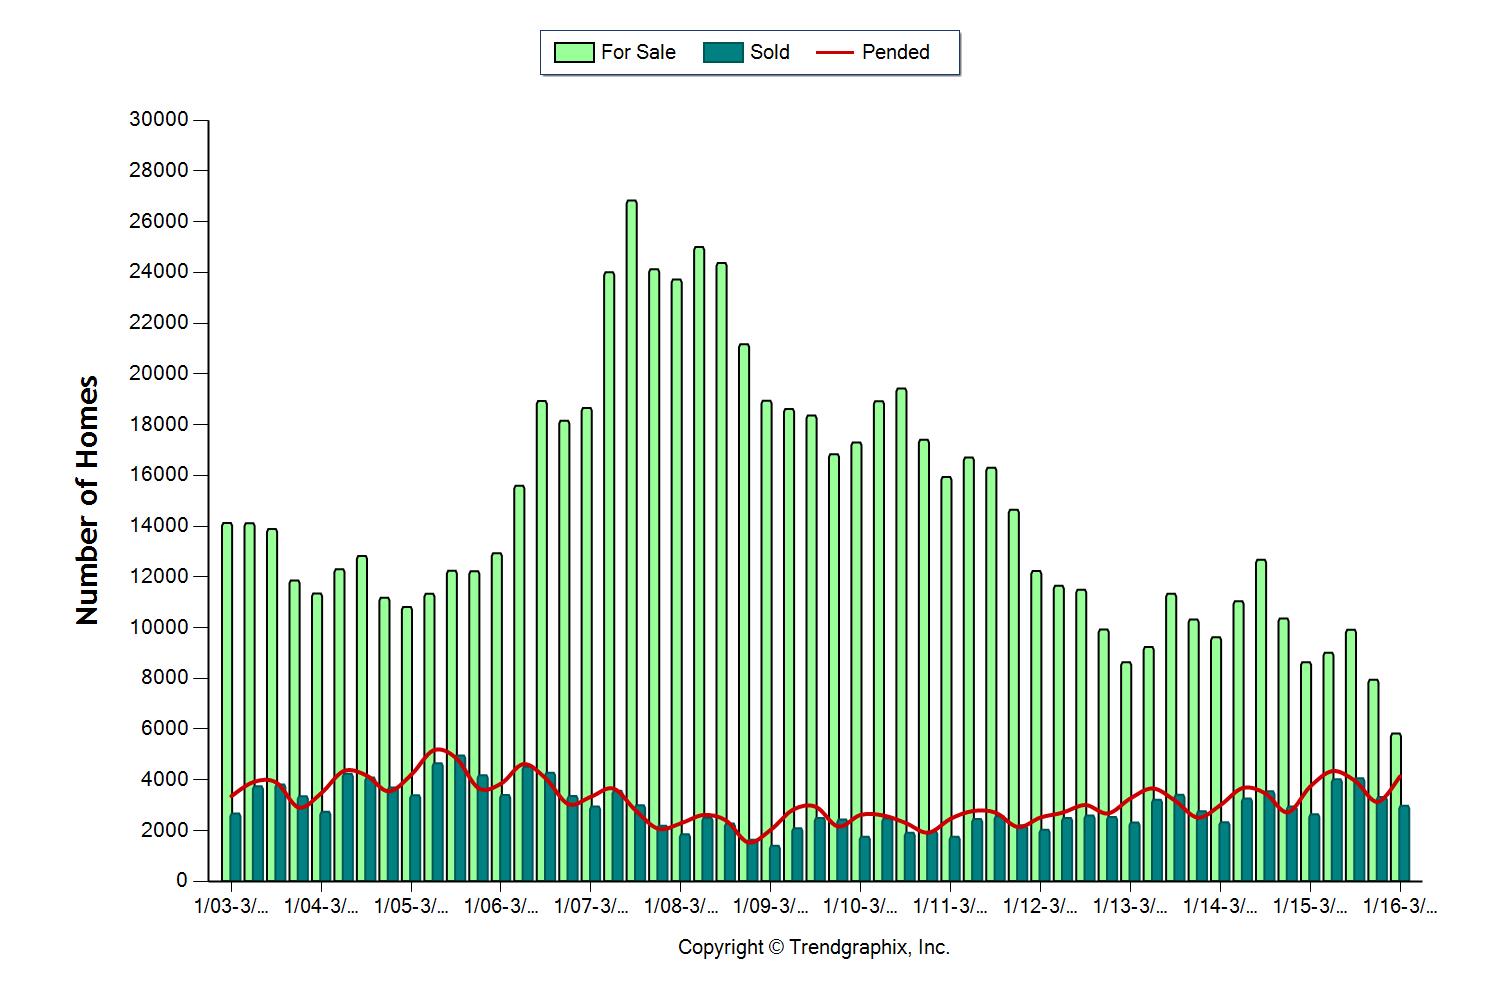
As soon as I prepared this graph the Pending line caught my attention, I call it the “Demand” line, and it is shown in red on this graph. When stepping back 14 years we can see there is certainly some fluctuation in the “Demand” line, but it looks relatively flat compared to the “Supply” line! Getting a little geeky I set out to measure the two, here’s what I learned after sifting through 14 years of data.
Next I wondered how often the demand or supply fluctuated higher or lower than 25% of the median. I wanted to know what, if anything is out of whack with our market “today”.
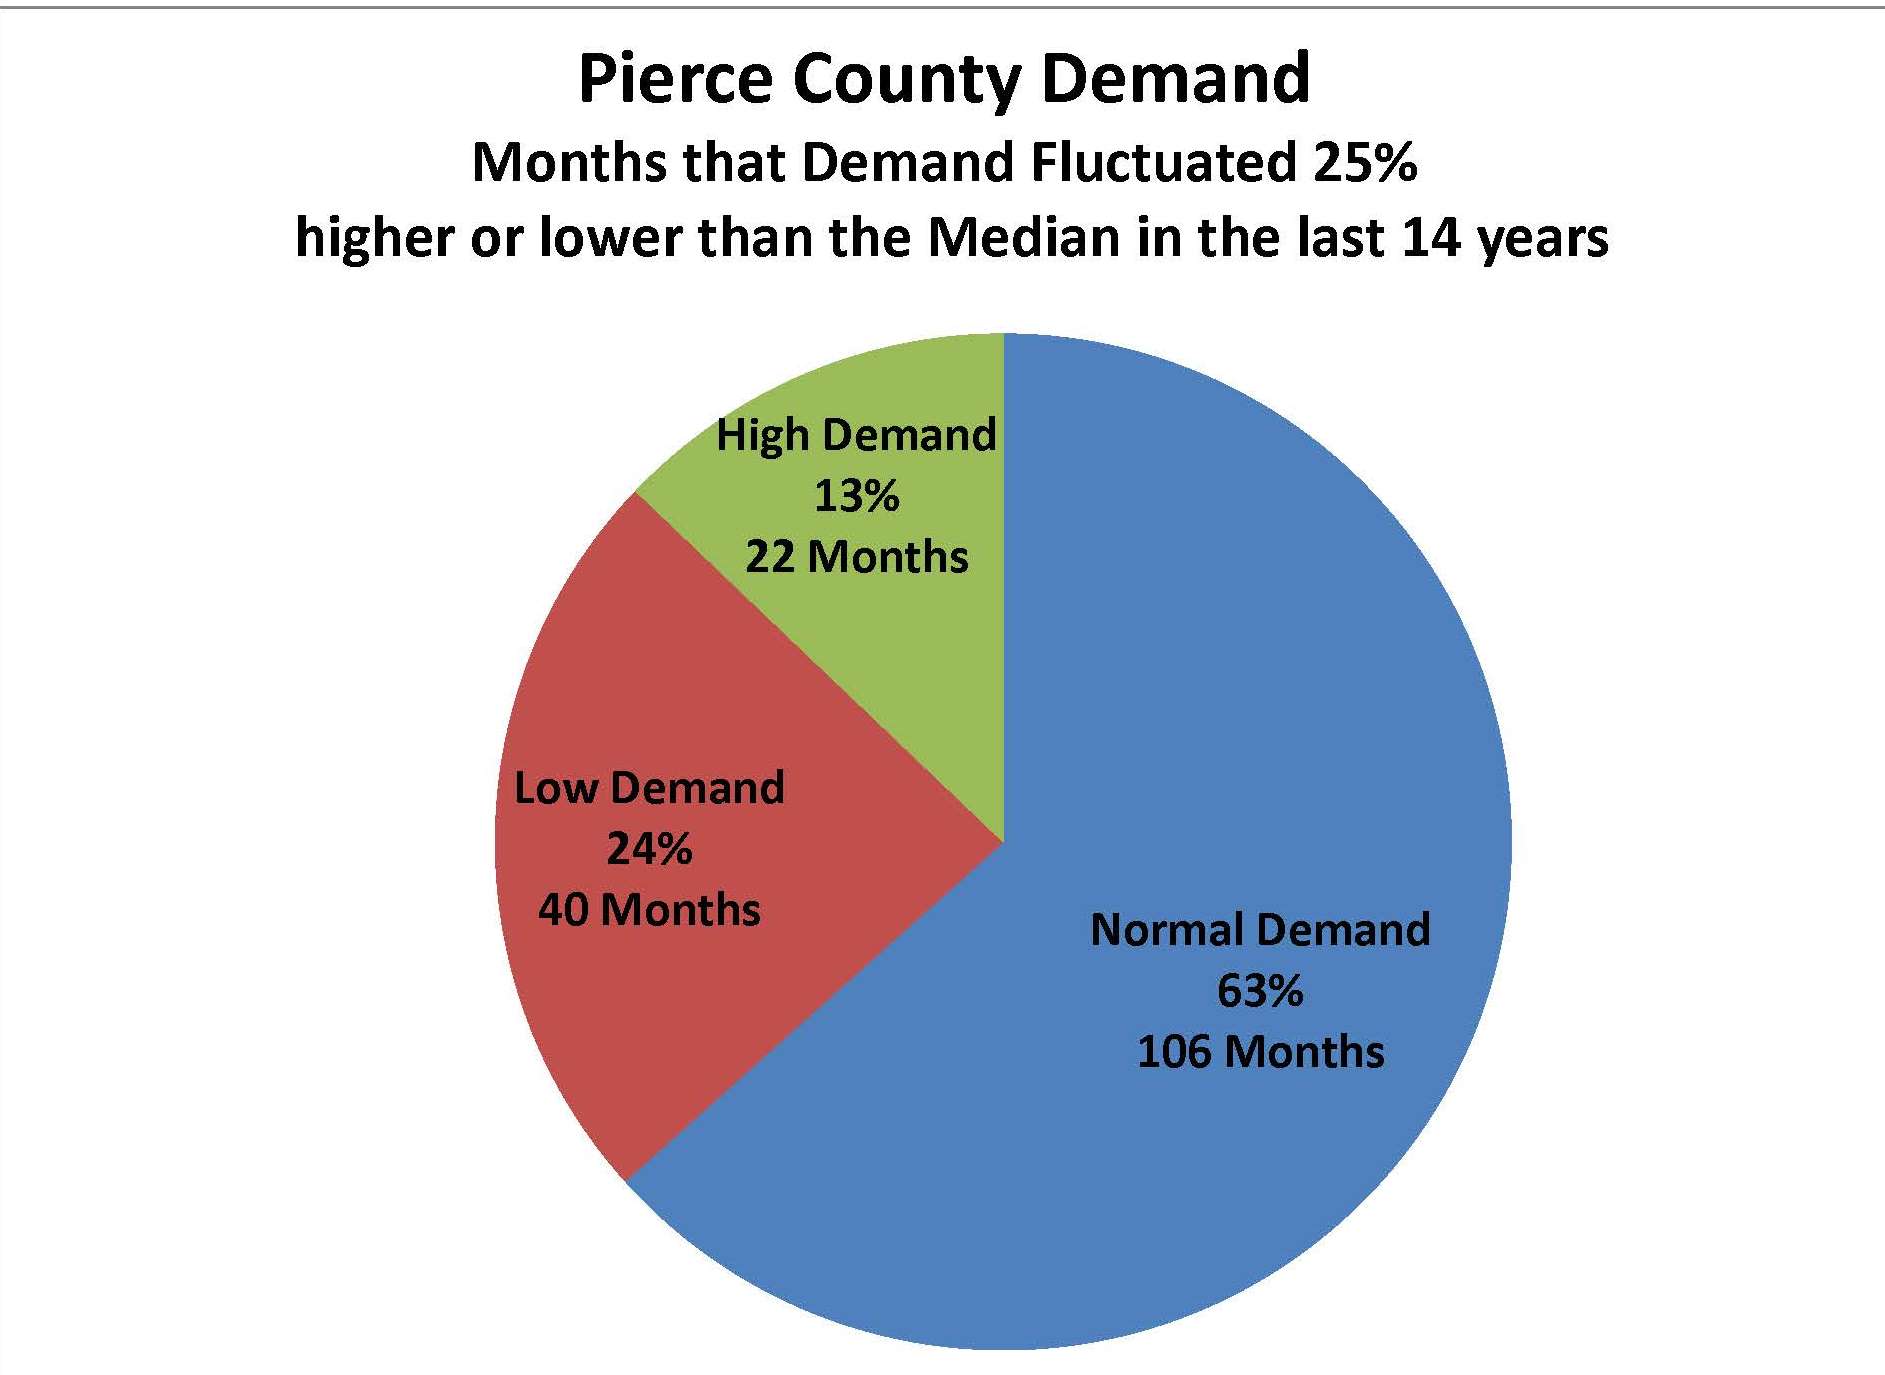
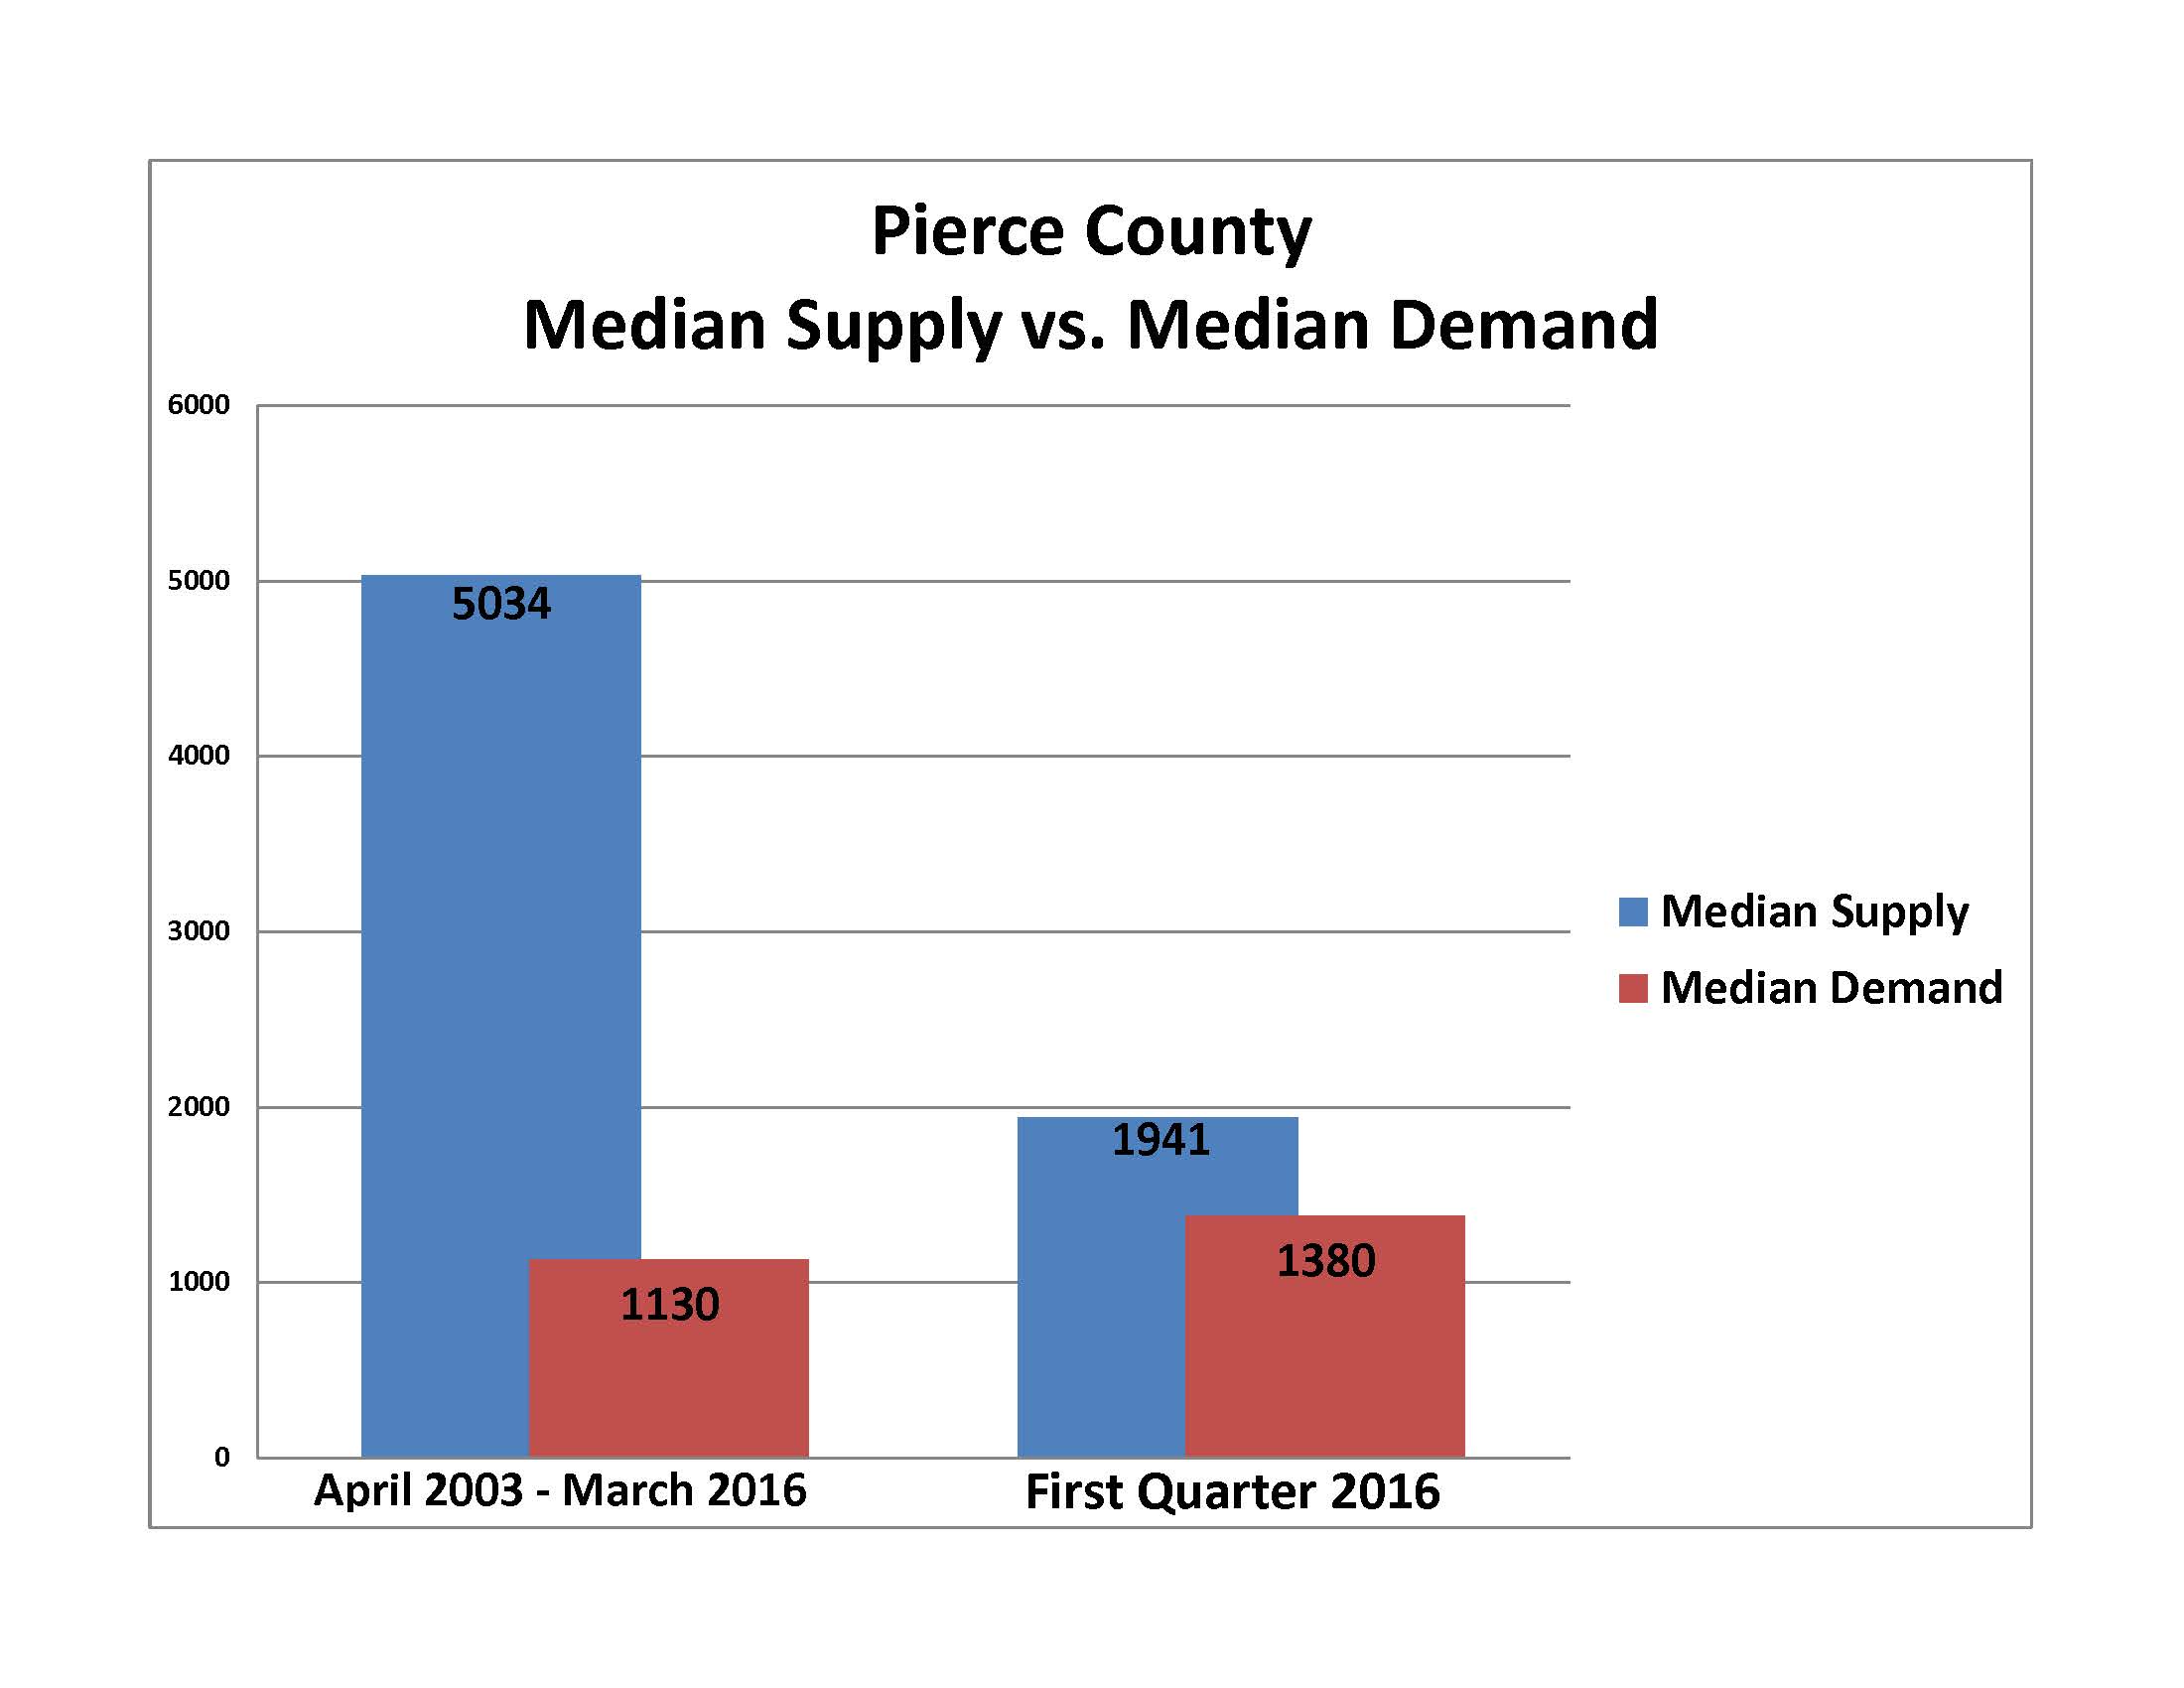
As you can see, in the last 14 years 63% of the time demand is within 25% of the median, and surprisingly has only been more than 25% above the median 22 out of 168 months (13%). Currently, demand for Pierce County housing as measured by 1st Quarter 2016 is in the high side of the “Normal” range. At 1,380 Pending sales it is 22% above our 14 year median. Not the same story for supply.
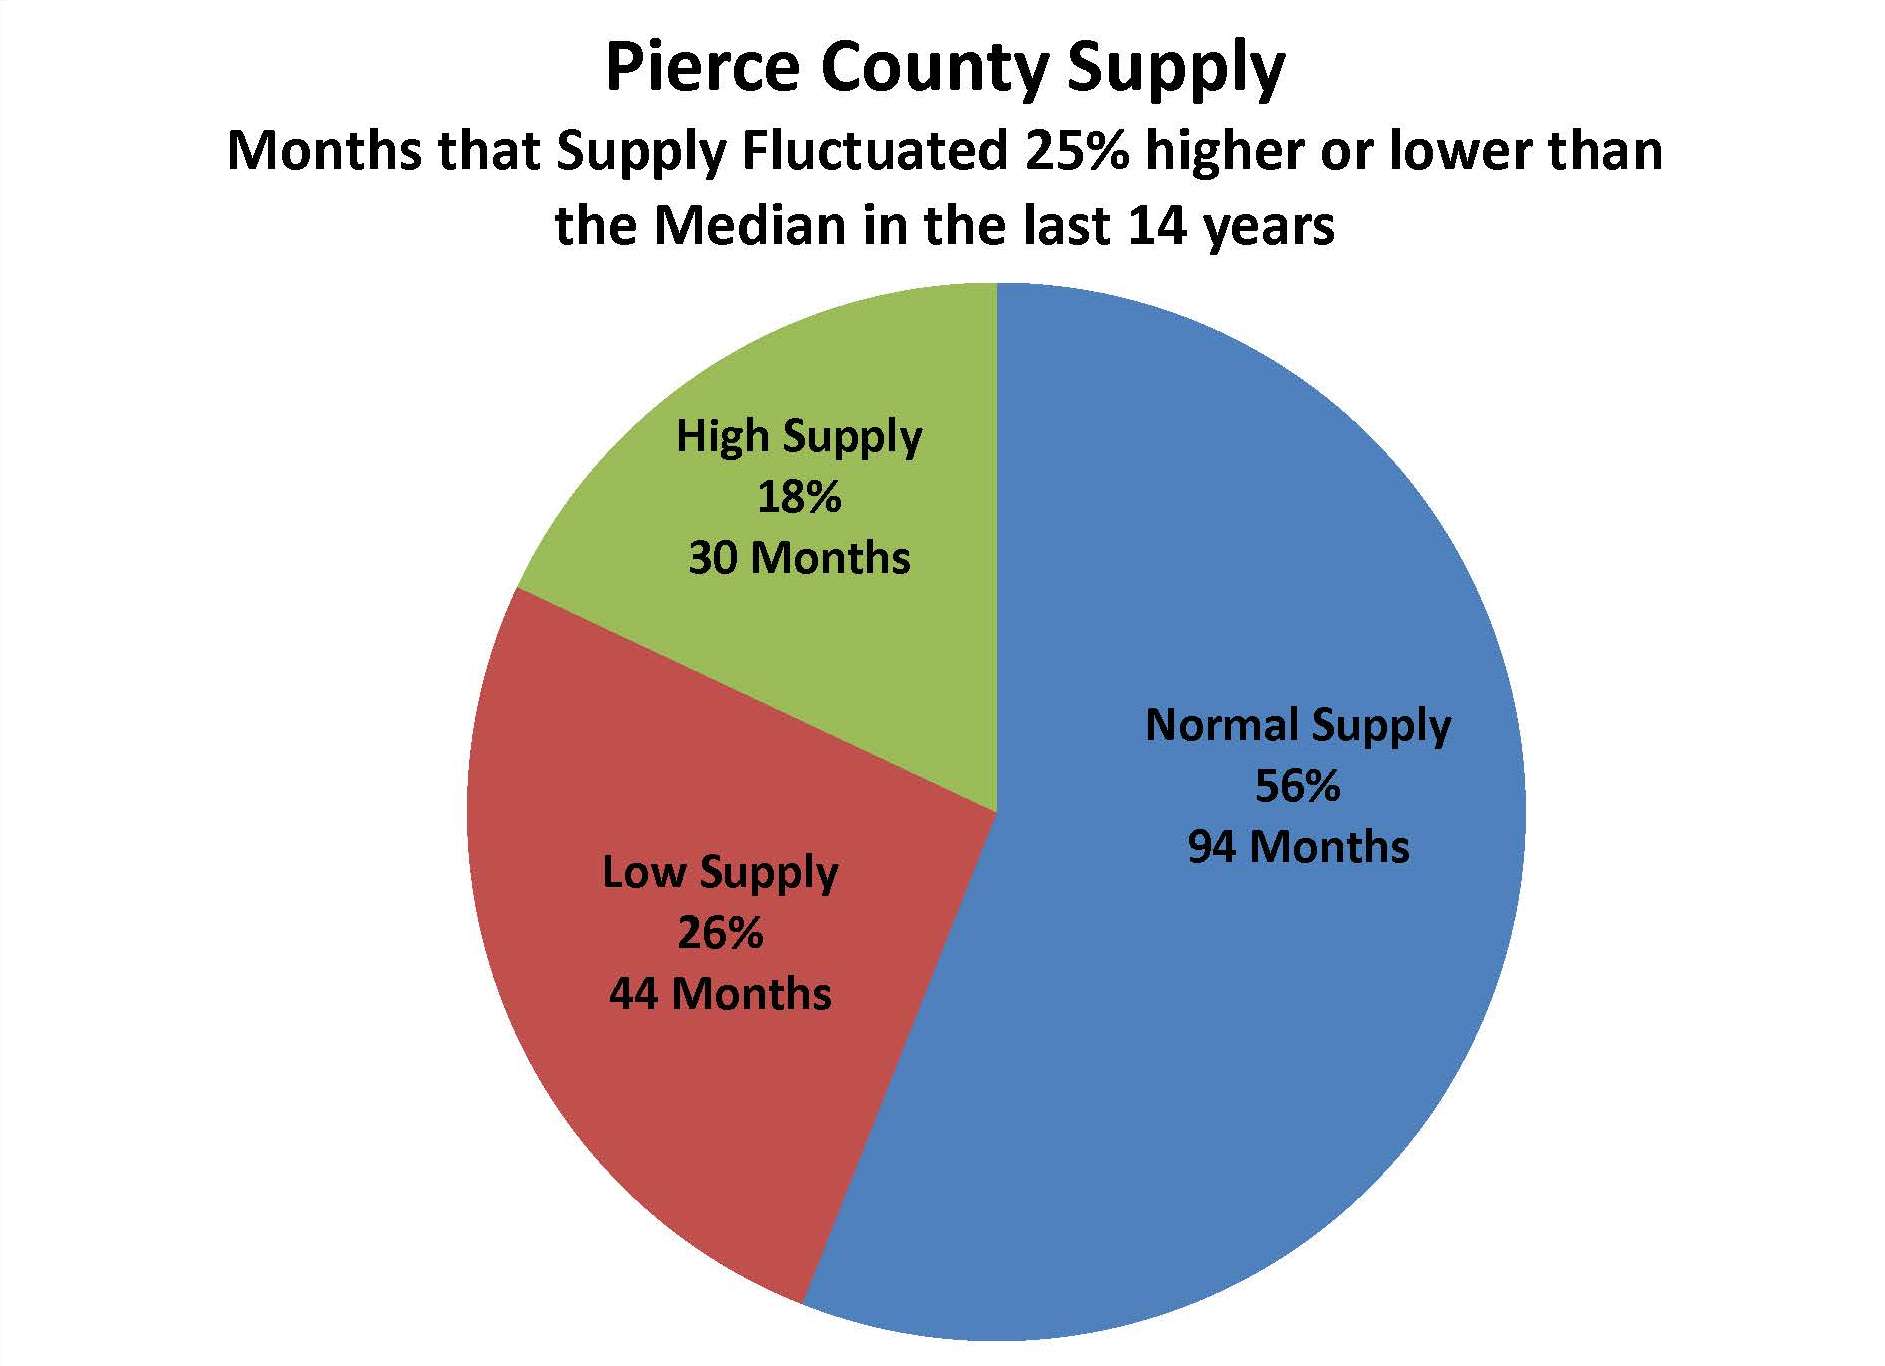
Our 1st Quarter supply average is 1,941 which is 61% below the median. Insert shocked face – here! – Pierce County is low on inventory! What is extraordinary about right now is the inventory has actually been in this “more than 25% below median” status for 29 of the last 36 months. Additionally, while I earlier stated that the 1st Quarter average demand is within the “norm”, if we only look at March demand it is 54% above the median making it one of the highest demand months in 14 years.
So what are we saying here?
Even though the market feels like there’s an extraordinary amount of pressure it’s been like this 80% of the last 3 years. March has us feeling market tensions in an exaggerated way due to a spike in demand along with the chronic low supply of homes we have been living with. It is also important to remember that the conditions described here are going to vary (sometimes a lot!) depending on where and what price range in Pierce County you are looking. This is one more reason why it is so important to have a Realtor at your side that can show you the #’s for your area. There are opportunities to sell into a High Demand/Low Supply sector and buy into a Normal Demand/Normal Supply sector. More on that next time!


